
Scientific advancements and literature on COVID-19 are constantly evolving, with many journals expediting COVID research for publication to keep up with the impressive pace of research. As new research findings become available, the landscape of knowledge gaps, new understandings, and emerging areas of research is taking shape. Here, I will compile a few interesting published articles in reputable journals (no pre-prints, for now) from the past week and summarize their findings to keep track of the many new things the scientific world is learning about COVID and make it accessible for a broader audience.
For this week’s summary, I’m reviewing four papers that have come out in the last week that discuss the potential for a 20th century TB vaccine to protect against COVID, what circumstances led to COVID-19 case increases, and the extent to which deaths are being under-reported in NYC.
1. BCG and COVID: Does this Old TB Vaccine Protect Against Severe COVID-19?
- Experimental Study: Hamiel, U., Kozer, E., & Youngster, I. (2020). SARS-CoV-2 Rates in BCG-Vaccinated and Unvaccinated Young Adults. JAMA – Journal of the American Medical Association, May 13.
- Commentary: O’Neill, L.A.J., Netea, M.G. BCG-induced trained immunity: can it offer protection against COVID-19?. Nat Rev Immunol(2020).
The Hamiel article was inspired by recent ecological studies finding that countries using the Bacille Calmette-Guérin (BCG) Tuberculosis (TB) vaccine in their childhood vaccination schedules have fewer confirmed cases and deaths of COVID-19 than countries without the vaccine in their schedules. BCG now is used in countries where TB is more prevalent.
The Theory: BCG Protects Against Respiratory Infections
As explained in O’Neill et al, the BCG vaccine, a live attenuated vaccine, is given to protect against TB. Since its development in the early 20th century, it has become the most used vaccine in the world, with about 130 million children vaccinated each year with BCG. Once the BCG vaccine was implemented in national immunization programs, studies began to find that BCG reduced infant mortality rates more than its effect on TB alone, with the vaccine seeming to provide additional protection against respiratory infections and sepsis. The BCG vaccine has been shown to have a protective effect on respiratory syncytial virus, pneumonia, influenza A, and herpes simplex virus type 2. This protective effect on respiratory infections, along with ecological data showing BCG seemed to reduce COVID infections, led Hamiel et al. to explore the impact of BCG on COVID-19 using a natural experiment design in Israel.
What they did
In Israel, the BCG vaccine was administered to all newborns between 1955-1982, but afterwards only to immigrants coming from countries with high rates of TB. Hamiel et al. used this natural experiment to explore COVID infections among those born during the 3 years before (1979-1981) and after (1983-1985) the BCG vaccine was removed from the schedule. Israel tests all patients with symptoms for COVID-19, providing a broader spectrum of identified illness than we have in the US.
What they found
Hamiel et al. found 3,064 positive COVID-19 cases among those tested born 1979-1981 and 2,869 COVID-19 cases who were born in 1983-1985. They did NOT find a statistically significant difference in the proportion of positive COVID-19 tests in the BCG vaccinated group vs. unvaccinated group (11.7% vs. 10.4%). Additionally, there was only 1 case of severe disease (and no deaths) reported in either group, thus they did not have enough data to observe any effects on severe disease.
What it means
The authors claim that their study did not provide additional evidence, at the individual level, for a protective relationship between BCG and COVID-19, which agrees with the WHO’s current stance. However, the authors acknowledge limitations that may have confounded their results: by including populations not born in Israel, they cannot be certain of vaccination status for non-Israelis. Additionally, O’Neill et al. explain that based on BCG’s immunologic mechanisms, it might reduce COVID-19 severity, but the authors did not have enough cases of severe disease or death to evaluate the impact of BCG vaccination on these outcomes.
My take
Ecological studies have shown a potential benefit of BCG vaccination on COVID-19 cases and severity, but an ecological study is the one study design where the unit of analysis is a group, not an individual. This makes ecological studies subject to a type of bias in epidemiology known as the ecologic fallacy. This bias comes from using aggregate data and assuming that observations at the group level hold for all individuals within that group.
A classic example from Boston University SPH of this fallacy compares coronary heart disease (CHD) mortality rates and average per-capita alcohol consumption across a variety of countries: finding a striking negative correlation: it seems that drinking more alcohol leads to lower death rates!

However, this assumes that these country-level estimates of drinking and mortality reflect individual probabilities: i.e. that the same people who are drinking more are less likely to die from CHD, which we cannot know from this data (and also contradicts our common sense). As a result of this fallacy, Ecologic studies CANNOT show causal relationships.
Hamiel et al.’s study is interesting, and does not corroborate the BCG hypothesis, but they also didn’t have enough data to evaluate the more pertinent outcomes such as severe disease. Overall, I’d say the jury is still out on whether BCG has a protective effect on COVID. As O’Neill et al describe, there are other limitations of the ecological studies: differences in demographic and genetic population structures, interventions, diagnosis and reporting of COVID-19, and the stage of the epidemic. Due to all these limitations, ultimately we will need randomized studies, which have the best ability to determine causal effects, to evaluate the role of BCG on COVID-19. According to the WHO, 2 randomized trials are already underway.
2. Understanding Circumstances that Caused COVID Spread
This article by Anne Schuchat, the Deputy Director of the CDC, outlines the timeline of COVID-19’s spread in the US and specific events that led to explosive growth of infection as lessons for events and circumstances to avoid as states begin to reopen.
COVID-19 Timeline in the US
From January 21 to February 23, 2020, there were 14 known cases of COVID-19 diagnosed in 6 states, in addition to 12 travelers from China, and 39 cases from repatriated Americans. However, by late February, cases emerged with no report of recent travel to affected areas, indicating there was ongoing COVID-19 transmission in the community. By mid-March, community transmission was well established in the US, and exponential case growth began. Genetic sequencing of COVID-19 showed that while the predominant outbreak strain in Washington was from China, the outbreak in New York was more likely introduced from Europe.
Events and Settings that allowed COVID-19 to Proliferate
It is important to understand the factors and settings that accelerated transmission and propelled new outbreaks in the early stages of the pandemic, as these are the best indicators for what might drive transmission and outbreaks in the future. In addition to international travel, cruises contributed significantly to COVID-19 case burdens in the U.S. and other countries (yet cruises are scheduled to resume in August, with dramatic increases in bookings)!
Specifically, three events had a large impact on growth of cases in the US in Feb 2020: (1) Mardi Gras in New Orleans (>1 million attendees), (2) an international conference in Boston with 175 attendees, and (3) a funeral in Albany, GA with 100 attendees. The epidemic curves below show the lag between these events and an explosion in location-specific cases, which all fit within the ~5-14 day incubation period for COVID-19.
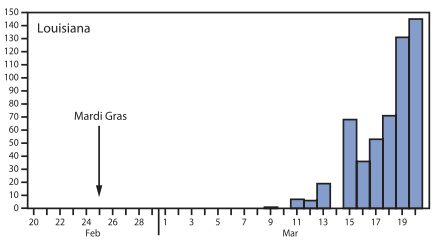

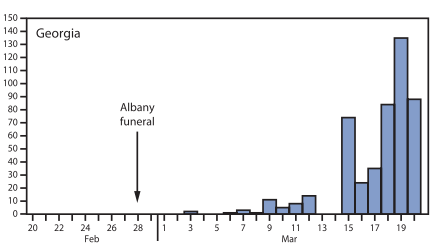
My Take
Large gatherings create an environment where COVID can spread easily and pose a risk for continued transmission – such gatherings would likely pose a similar risk in the fall, and it will be hard to imagine parades, sporting events, dormitory living, and concerts occurring without causing similar increases in COVID-19 cases. I think more specific research is needed, to inform specific guidance on how many individuals in one place is “too many” for explosive outbreak potential – because having a long-term no gatherings policy seems unsustainable. I fear for what will happen as states reopen and individual business owners make their own decisions about group sizes without an evidence-base.
3. Excess Mortality in NYC
We know that COVID-19 deaths are undercounted. Dr. Fauci has gone on the record to say so, and investigations by the Washington Post and New York Times have found significant excess deaths beyond the reported numbers. The question is how much are COVID-19 deaths undercounted? This paper explores excess deaths in NYC – the hardest hit area from COVID-19 in the US.
How does NYC Count COVID-19 Deaths?
The NYC Department of Health uses a daily match system between deaths reported to their vital registry system and laboratory-confirmed cases of COVID-19. If a death record specifically lists COVID-19 as a cause of death but there is no lab confirmation, this would count as a “probable” COVID-19 death. Only deaths with lab confirmation are “confirmed” COVID-19 deaths, as is the official death coding process according to the International Classification of Diseases System. As of May 2, there were 13,831 lab-confirmed COVID deaths, and 5,048 probable deaths in NYC.
This Tally is an Underestimate
There are other deaths that are not being counted using these metrics. These include deaths among those who: didn’t get tested, tested falsely negative, became positive after first testing negative, died at home, or COVID-19 was not suspected as a cause of death. This count also doesn’t include deaths not directly caused by COVID-19.
What They Did
The authors used a seasonal regression model (a tool often used to look at impact of flu) to calculate excess deaths from March 11 – May 2 (looking back to 2015 for comparison). During this period, 32,107 deaths were reported, of which 24,172 were in excess of seasonal norms (i.e. above the numbers of deaths expected based on the number of deaths observed for the same period in 2015-2019) (95% CI 22,980-25,364). Of these 24,172, 57% were confirmed COVID-19 deaths (n = 13,831) and 21% were probable COVID-19 deaths (n = 5,048), leaving 22%, or 5,293 excess deaths.

My Take
We are undercounting COVID-19 deaths! We know that many people are avoiding hospitals and changing their normal care-seeking behaviors for treatment and/or maintenance of mild or chronic health conditions, and this article provides a more inclusive measure of expected actual death toll, which is 5,293 deaths higher than the official tally. This likely indicates that COVID-19 deaths are undercounted in other areas of the country as well – and the full extent of the deaths and morbidity caused by COVID-19 is worse than the numbers being reported.
In other words…
Stay home, keep wearing masks, and keep washing your hands! This is not a drill!
Tune in for next week’s COVID-19 digest on a few new articles to keep up with the ever-changing research knowledge on this novel virus.

Leave a comment